
What comes to mind when you think of the average electric vehicle owner? Where do they live and what is their economic status? These are excellent questions to ask when assessing where to build EV charging infrastructure, but are impressions correct and rooted in reality? Are community resources being distributed equitably or are misconceptions leaving communities under served?
Makello decided to look at the data. We downloaded the City of San Diego 2019 Climate Equity Report, California Energy Commission 2020 ZEV and Infrastructure Stats for Vehicle Population, and the US Dept. of Energy Alternative Fuels Data Center CSV Alternative Fuels Data Center: Alternative Fueling Station Locator data, and we used the data to create some maps.
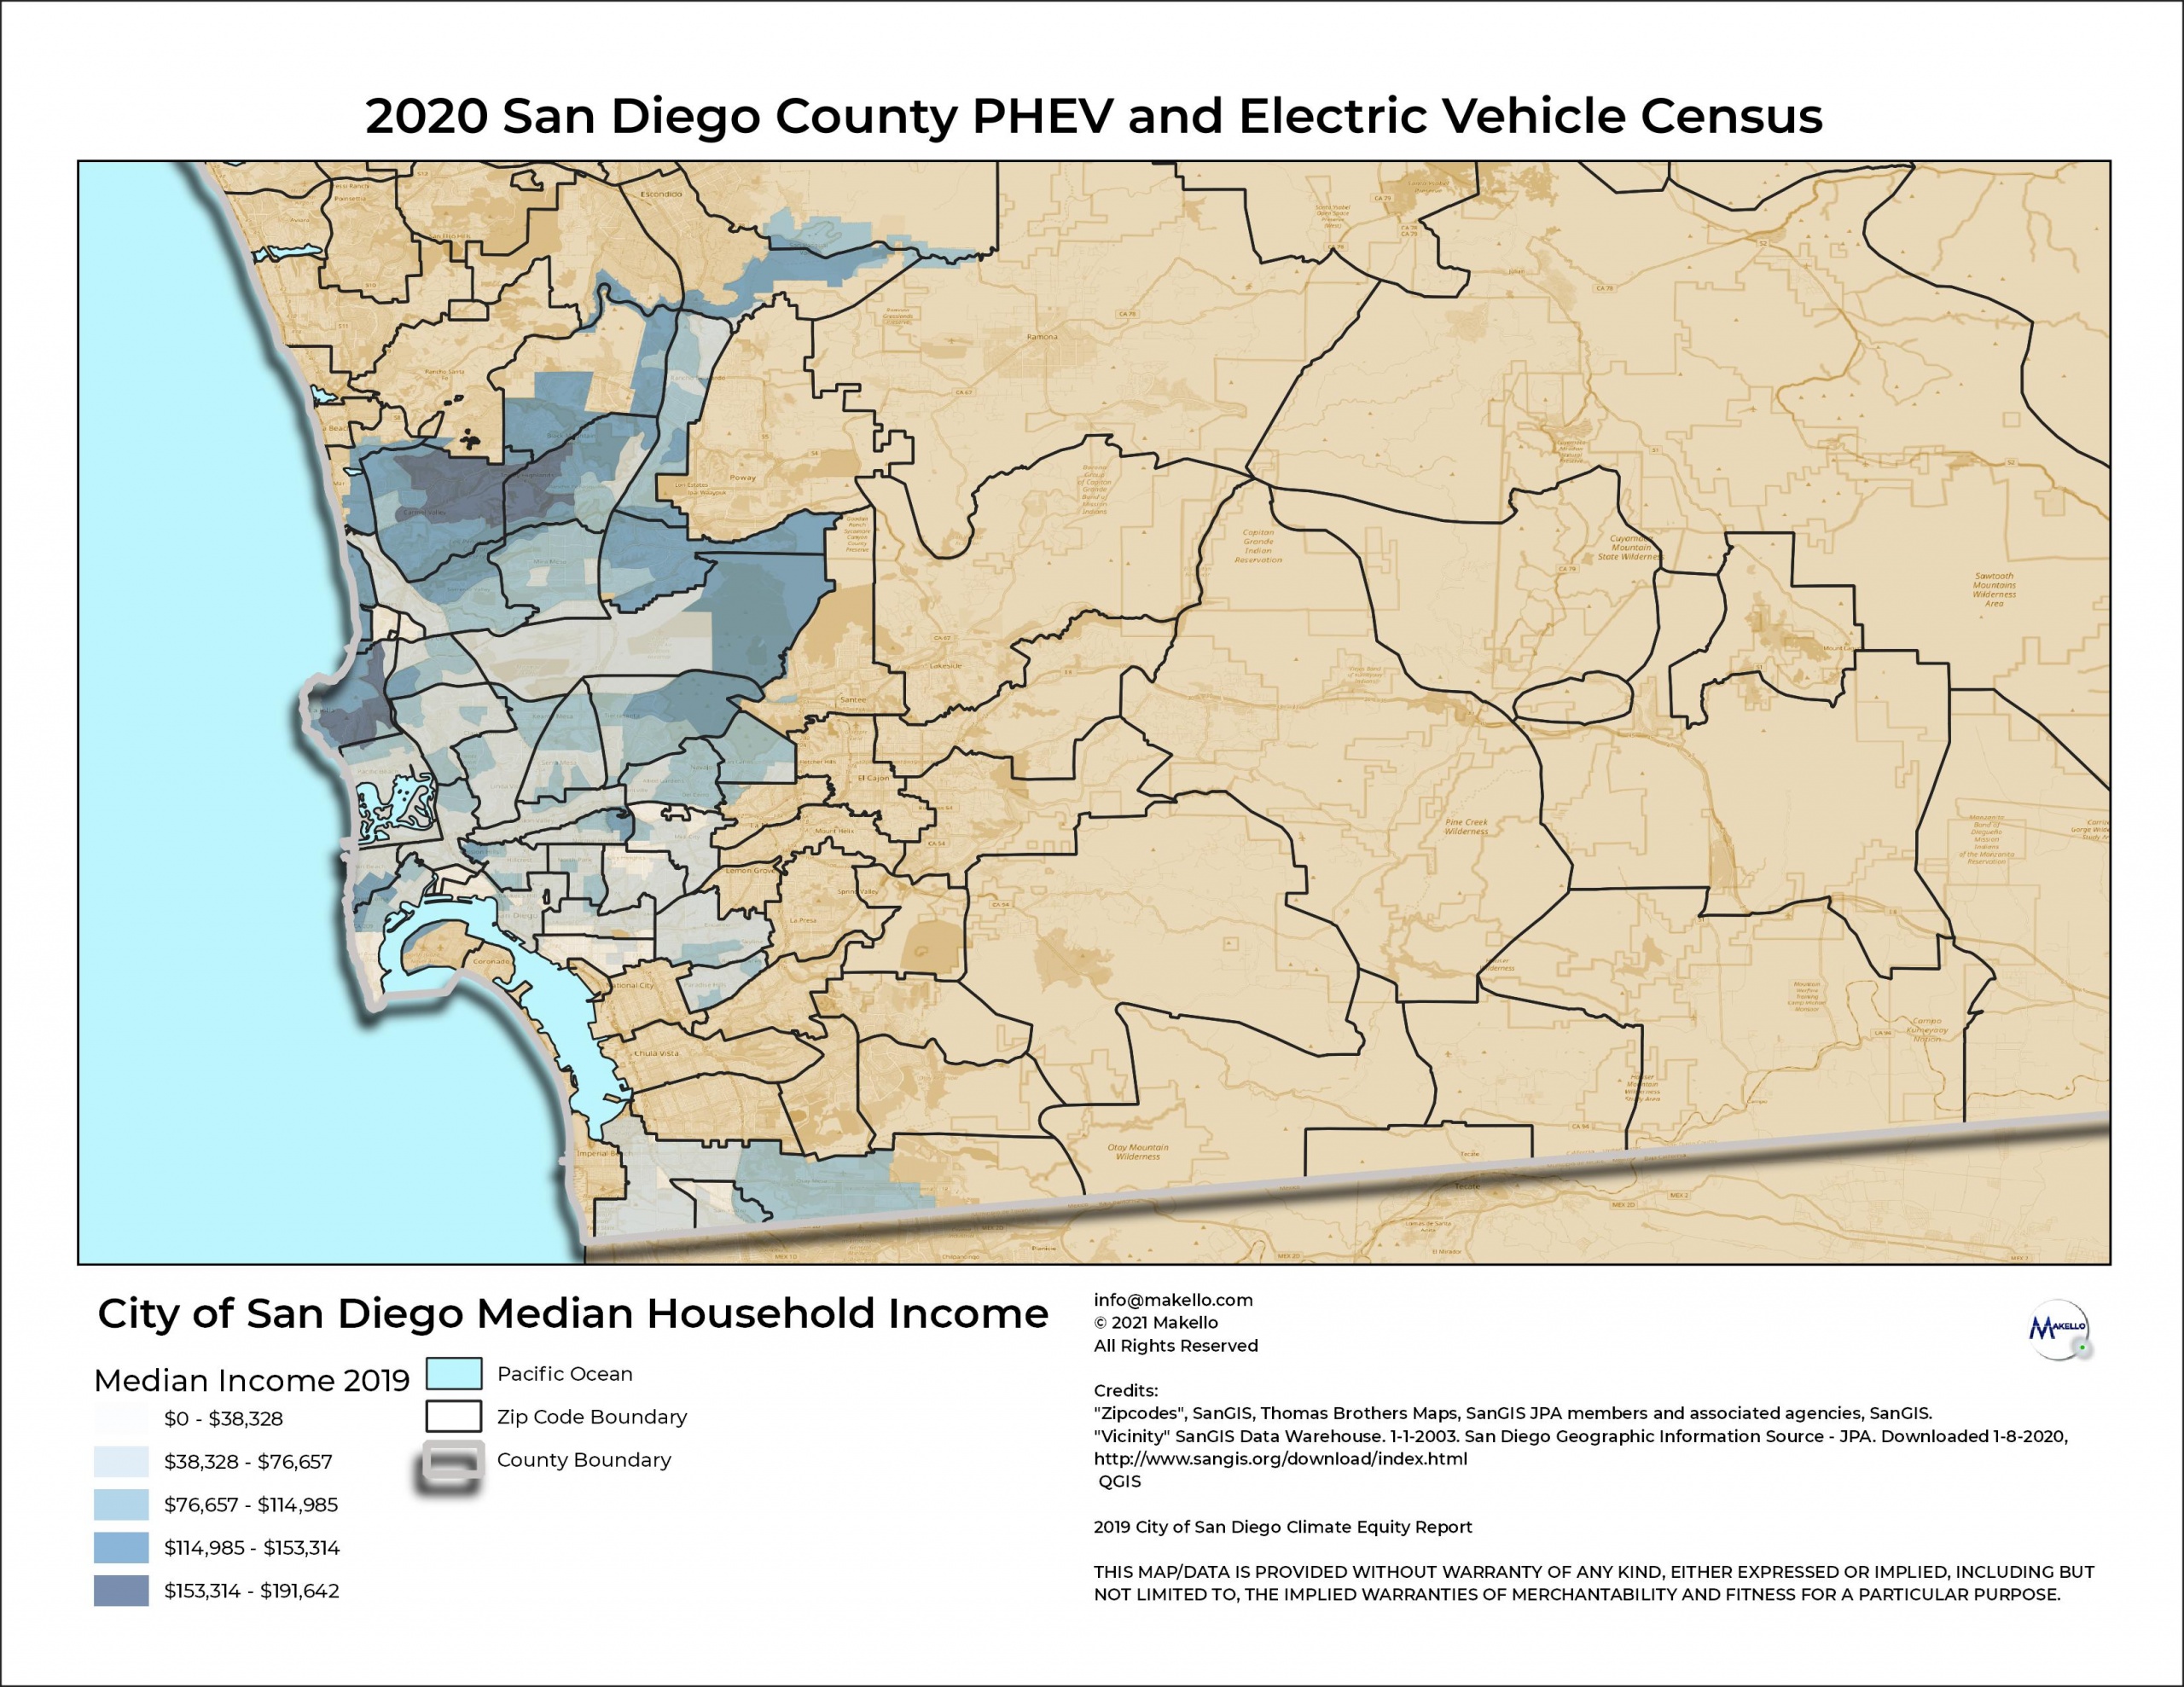
First, we reviewed the Median Household Income data from the City of San Diego 2019 Climate Equity Report to get an idea about income levels of residents within the City. The City of San Diego 2019 Climate Equity Report used the Census Tract as the smallest area to determine report indicators. The vehicle sales data uses zip codes as the unit for determining area of sales so we have overlaid the zip code outline over the map of Census Tract Median Income data for easier comparison.
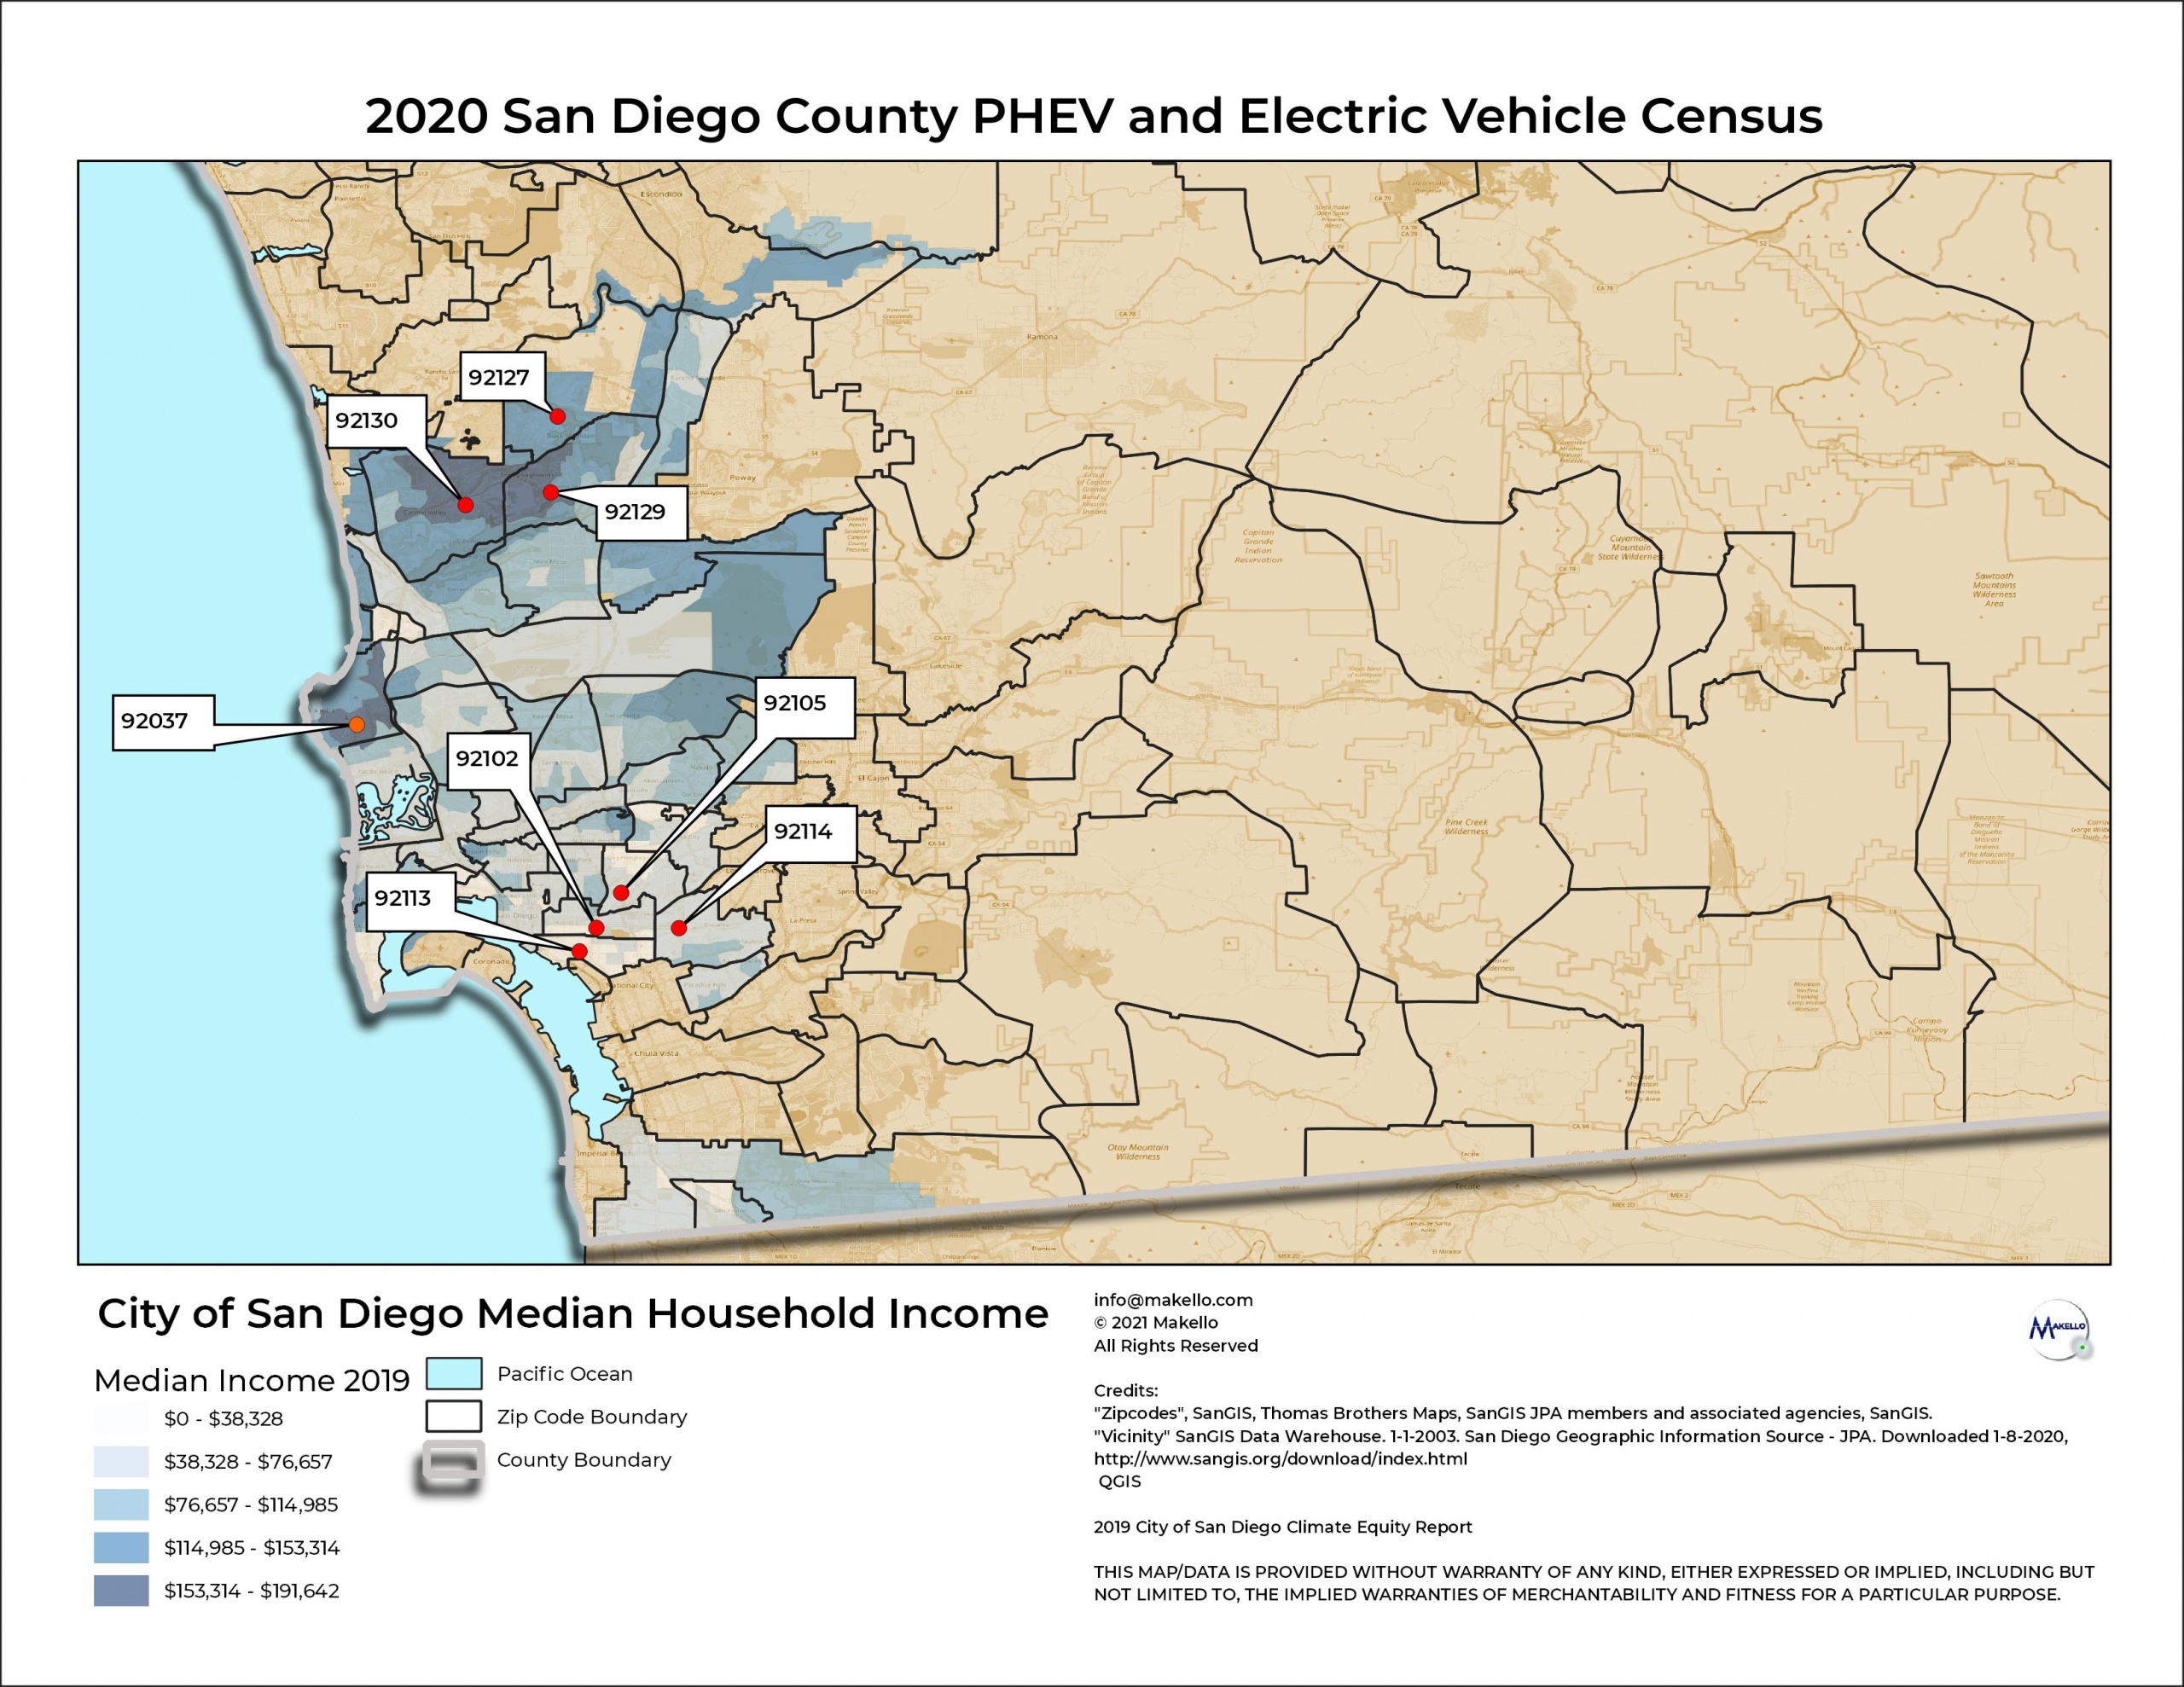
Are there unexpected communities purchasing EV and PHEV vehicles? We sorted the 2020 vehicle sales data by fuel type to select the Battery Electric Vehicle (EV) and Plug in Hybrid Electric Vehicle (PHEV) sales and joined the resulting tables with the zip code shapefile downloaded from the SanDAG Data Warehouse. This enabled us to show the 2020 vehicle sales by zip code on a map. The map of median income was then compared to EV and PHEV sales. Starting with EV sales, we looked at four zip codes with census tracts identified as higher income areas and four zip codes in an area identified in the San Diego 2019 Climate Equity Report as communities with less access to opportunities. Those zip codes are 92037, 92102, 92105, 92113, 9211, 92127, 92129, 92130.
Find out how much you can save with Electric Vehicles and discount utility rates.
Now that we have determined which areas we wished to compare, we created a map by sorting the 2020 vehicle sales data by fuel type to select the Battery Electric Vehicle (EV) and Plug in Hybrid Electric Vehicle (PHEV) sales and joined the resulting tables with the zip code shapefile downloaded from the SanDAG Data Warehouse. This enabled us to show the 2020 EV vehicle sales by zip code on a map as indicated by the symbol showing the number of vehicles sold shown here ![]()
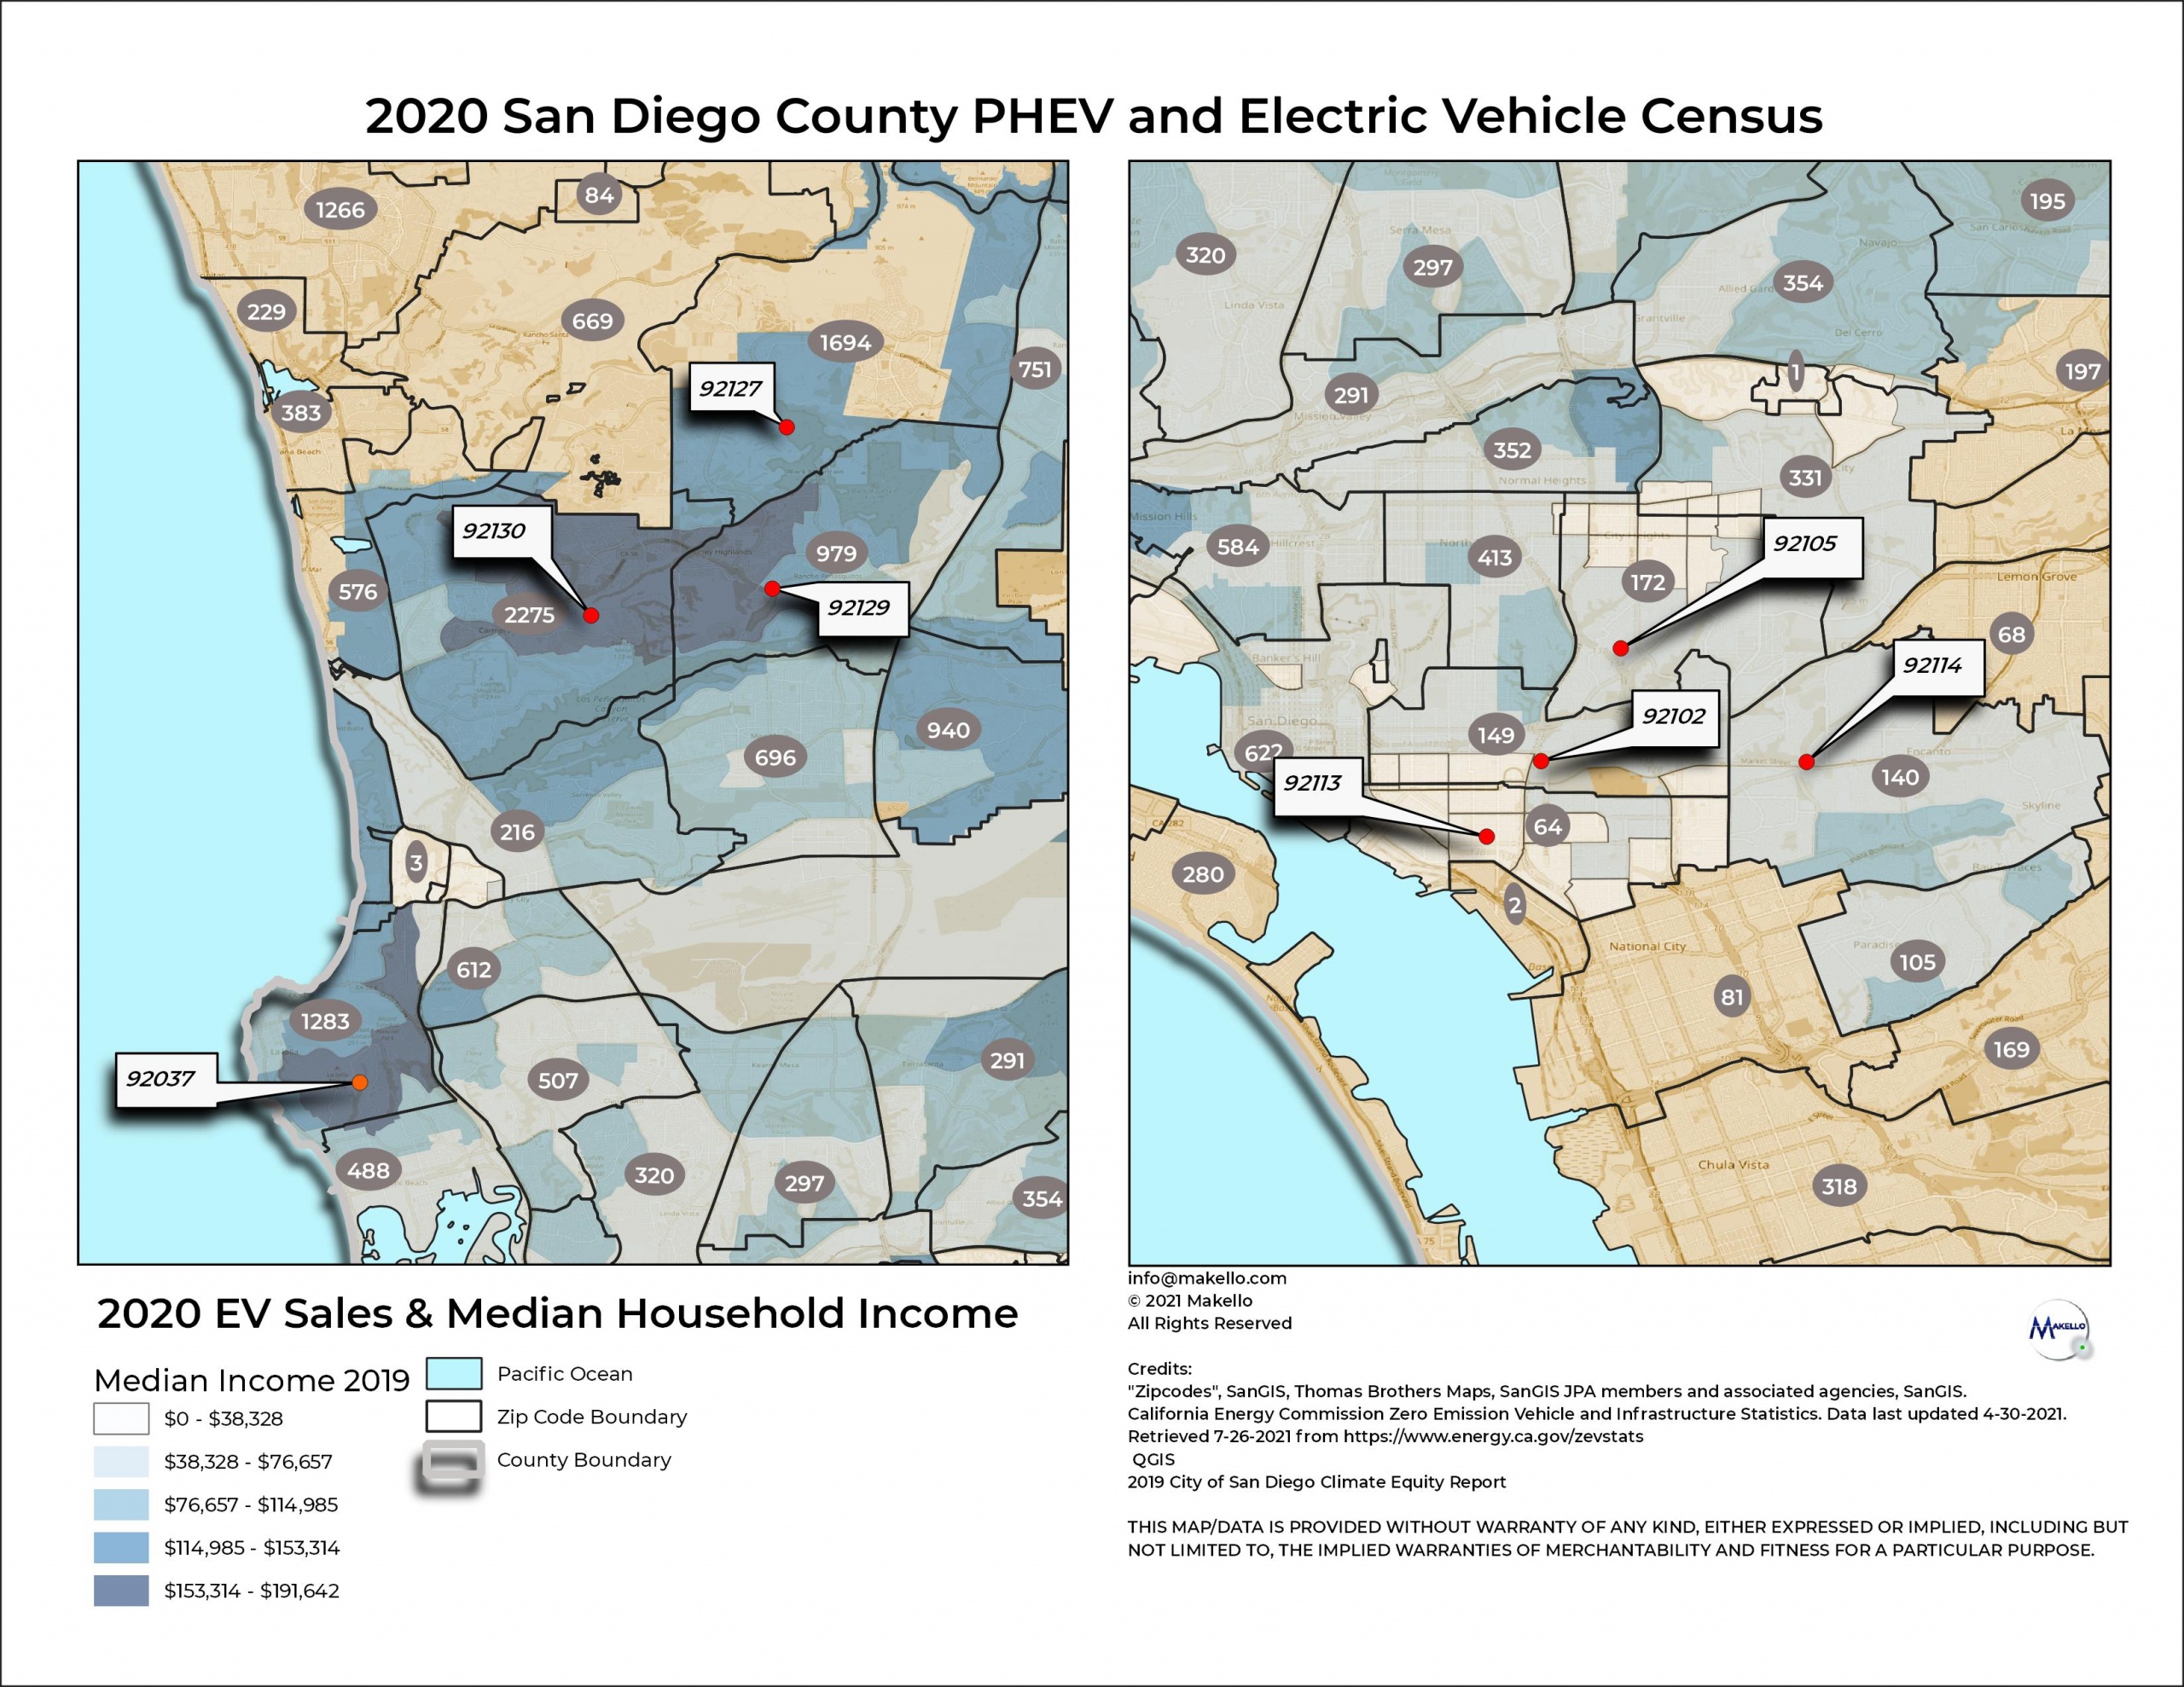
As you can see from the map, the highest EV sales are in and around the neighborhoods with the top range for median income. The top three EV purchasers in San Diego County are living in 92130, 92129 and 92037 respectively. Surprisingly, and more interestingly, the zip codes we chose to look at that are in areas identified as having less access to equity in San Diego show residents in these areas are purchasing electric vehicles in fair quantities.
The other 3 zip codes near 92113 have double the EV sales with 92114 residents purchasing 140 EV, 92102 residents purchasing 149 EV and 92105 residents purchasing 172 EV. The median income for the nearby residents are overall in the next higher income bracket. This shows that as vehicles become available that are priced attractively to the residents in these neighborhoods, they will make the purchase. There is an interest in greener options and a willingness to adopt technology at the right price point and feature package.
What about Plug-in Hybrid Electric Vehicle (PHEV) Sales? Makello mapped 2020 PHEV sales using the same procedure for 2020 EV Sales.
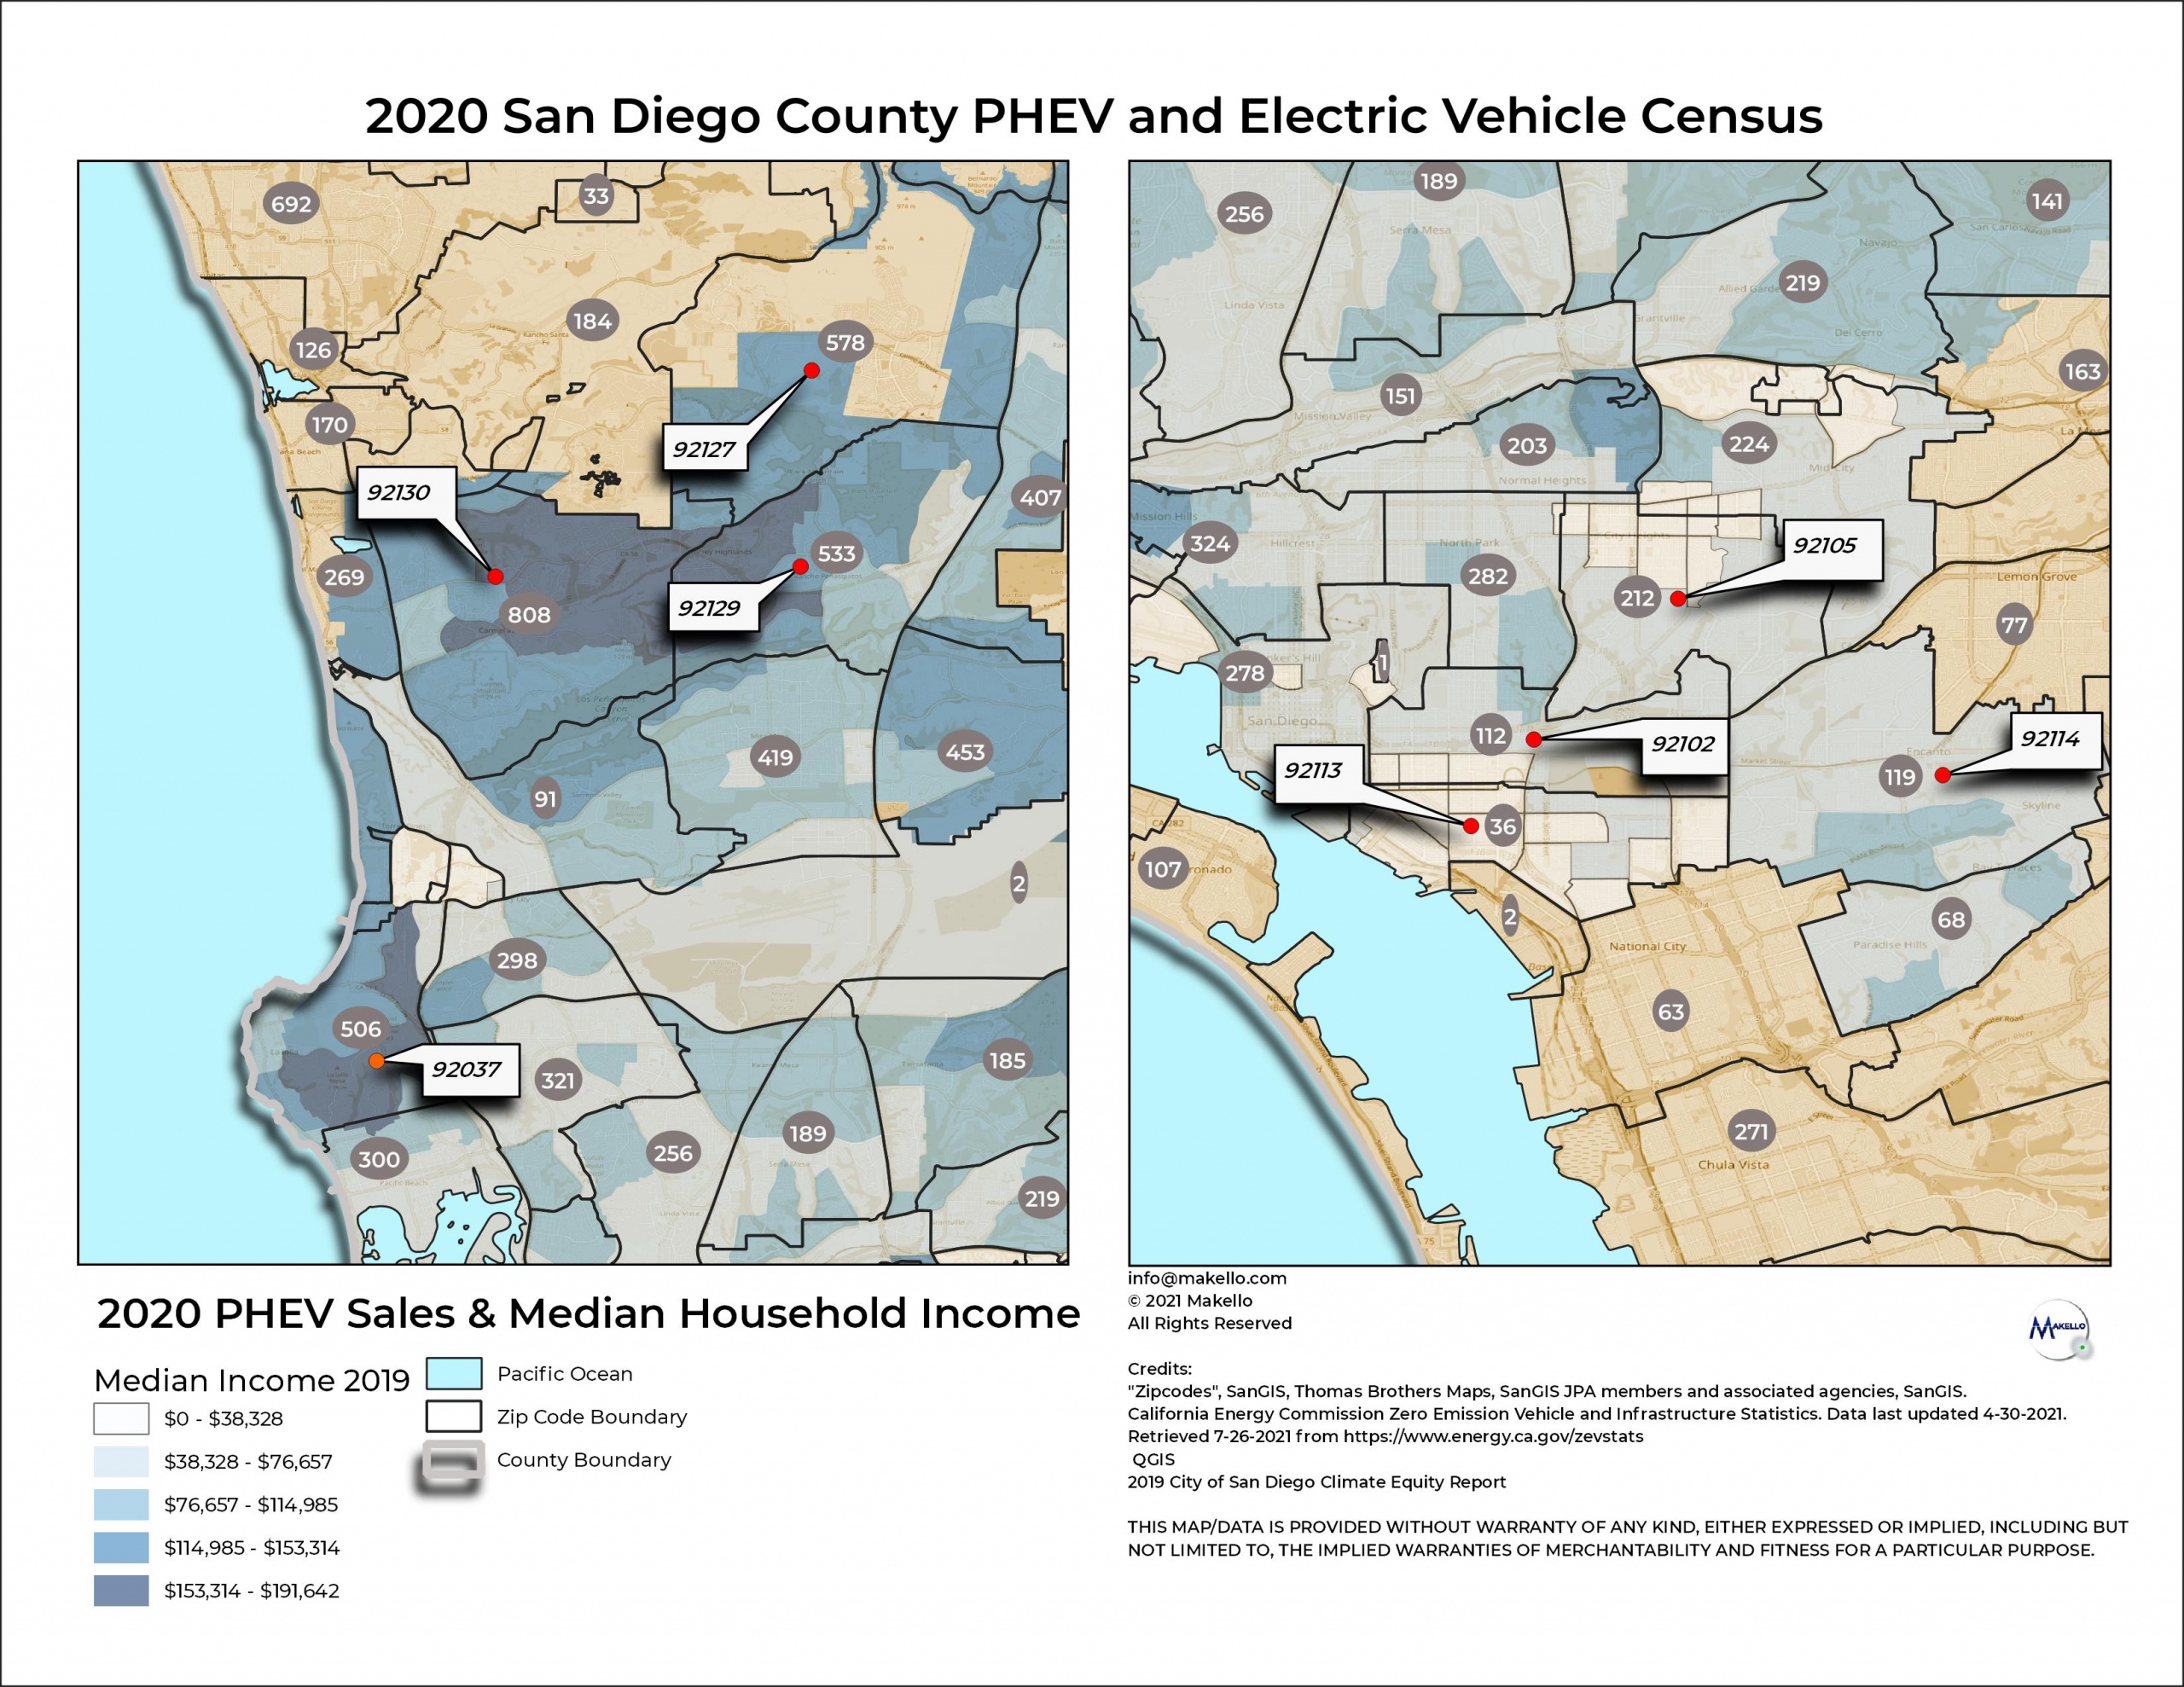
The map indicates PHEV purchases are more level across the City but there is one very unexpected find. PHEV sales are half as many as the EV sales in the 92113 zip code. Plug-in Hybrid Electric Vehicles are generally considered to be the more affordable option but they do not seem to be as enticing as the full battery electric vehicles for the residents in the 92113 zip code. This is contrary to conventional wisdom especially considering 2020 was a Pandemic Year and large numbers of the population were facing additional income stressors.
The final question is how are the public charging stations distributed and how does the distribution compare to the vehicle purchases? Are communities under served? Makello created a map of the public charging stations using data downloaded from the US Dept. of Energy Fuel Stations locator map https://afdc.energy.gov/stations/#/find/nearest. Station data is imported daily directly from the networks of Blink, ChargePoint, Electrify America, EVgo, FLO, Greenlots, OpConnect, SemaConnect, and Webasto into the Station Locator.
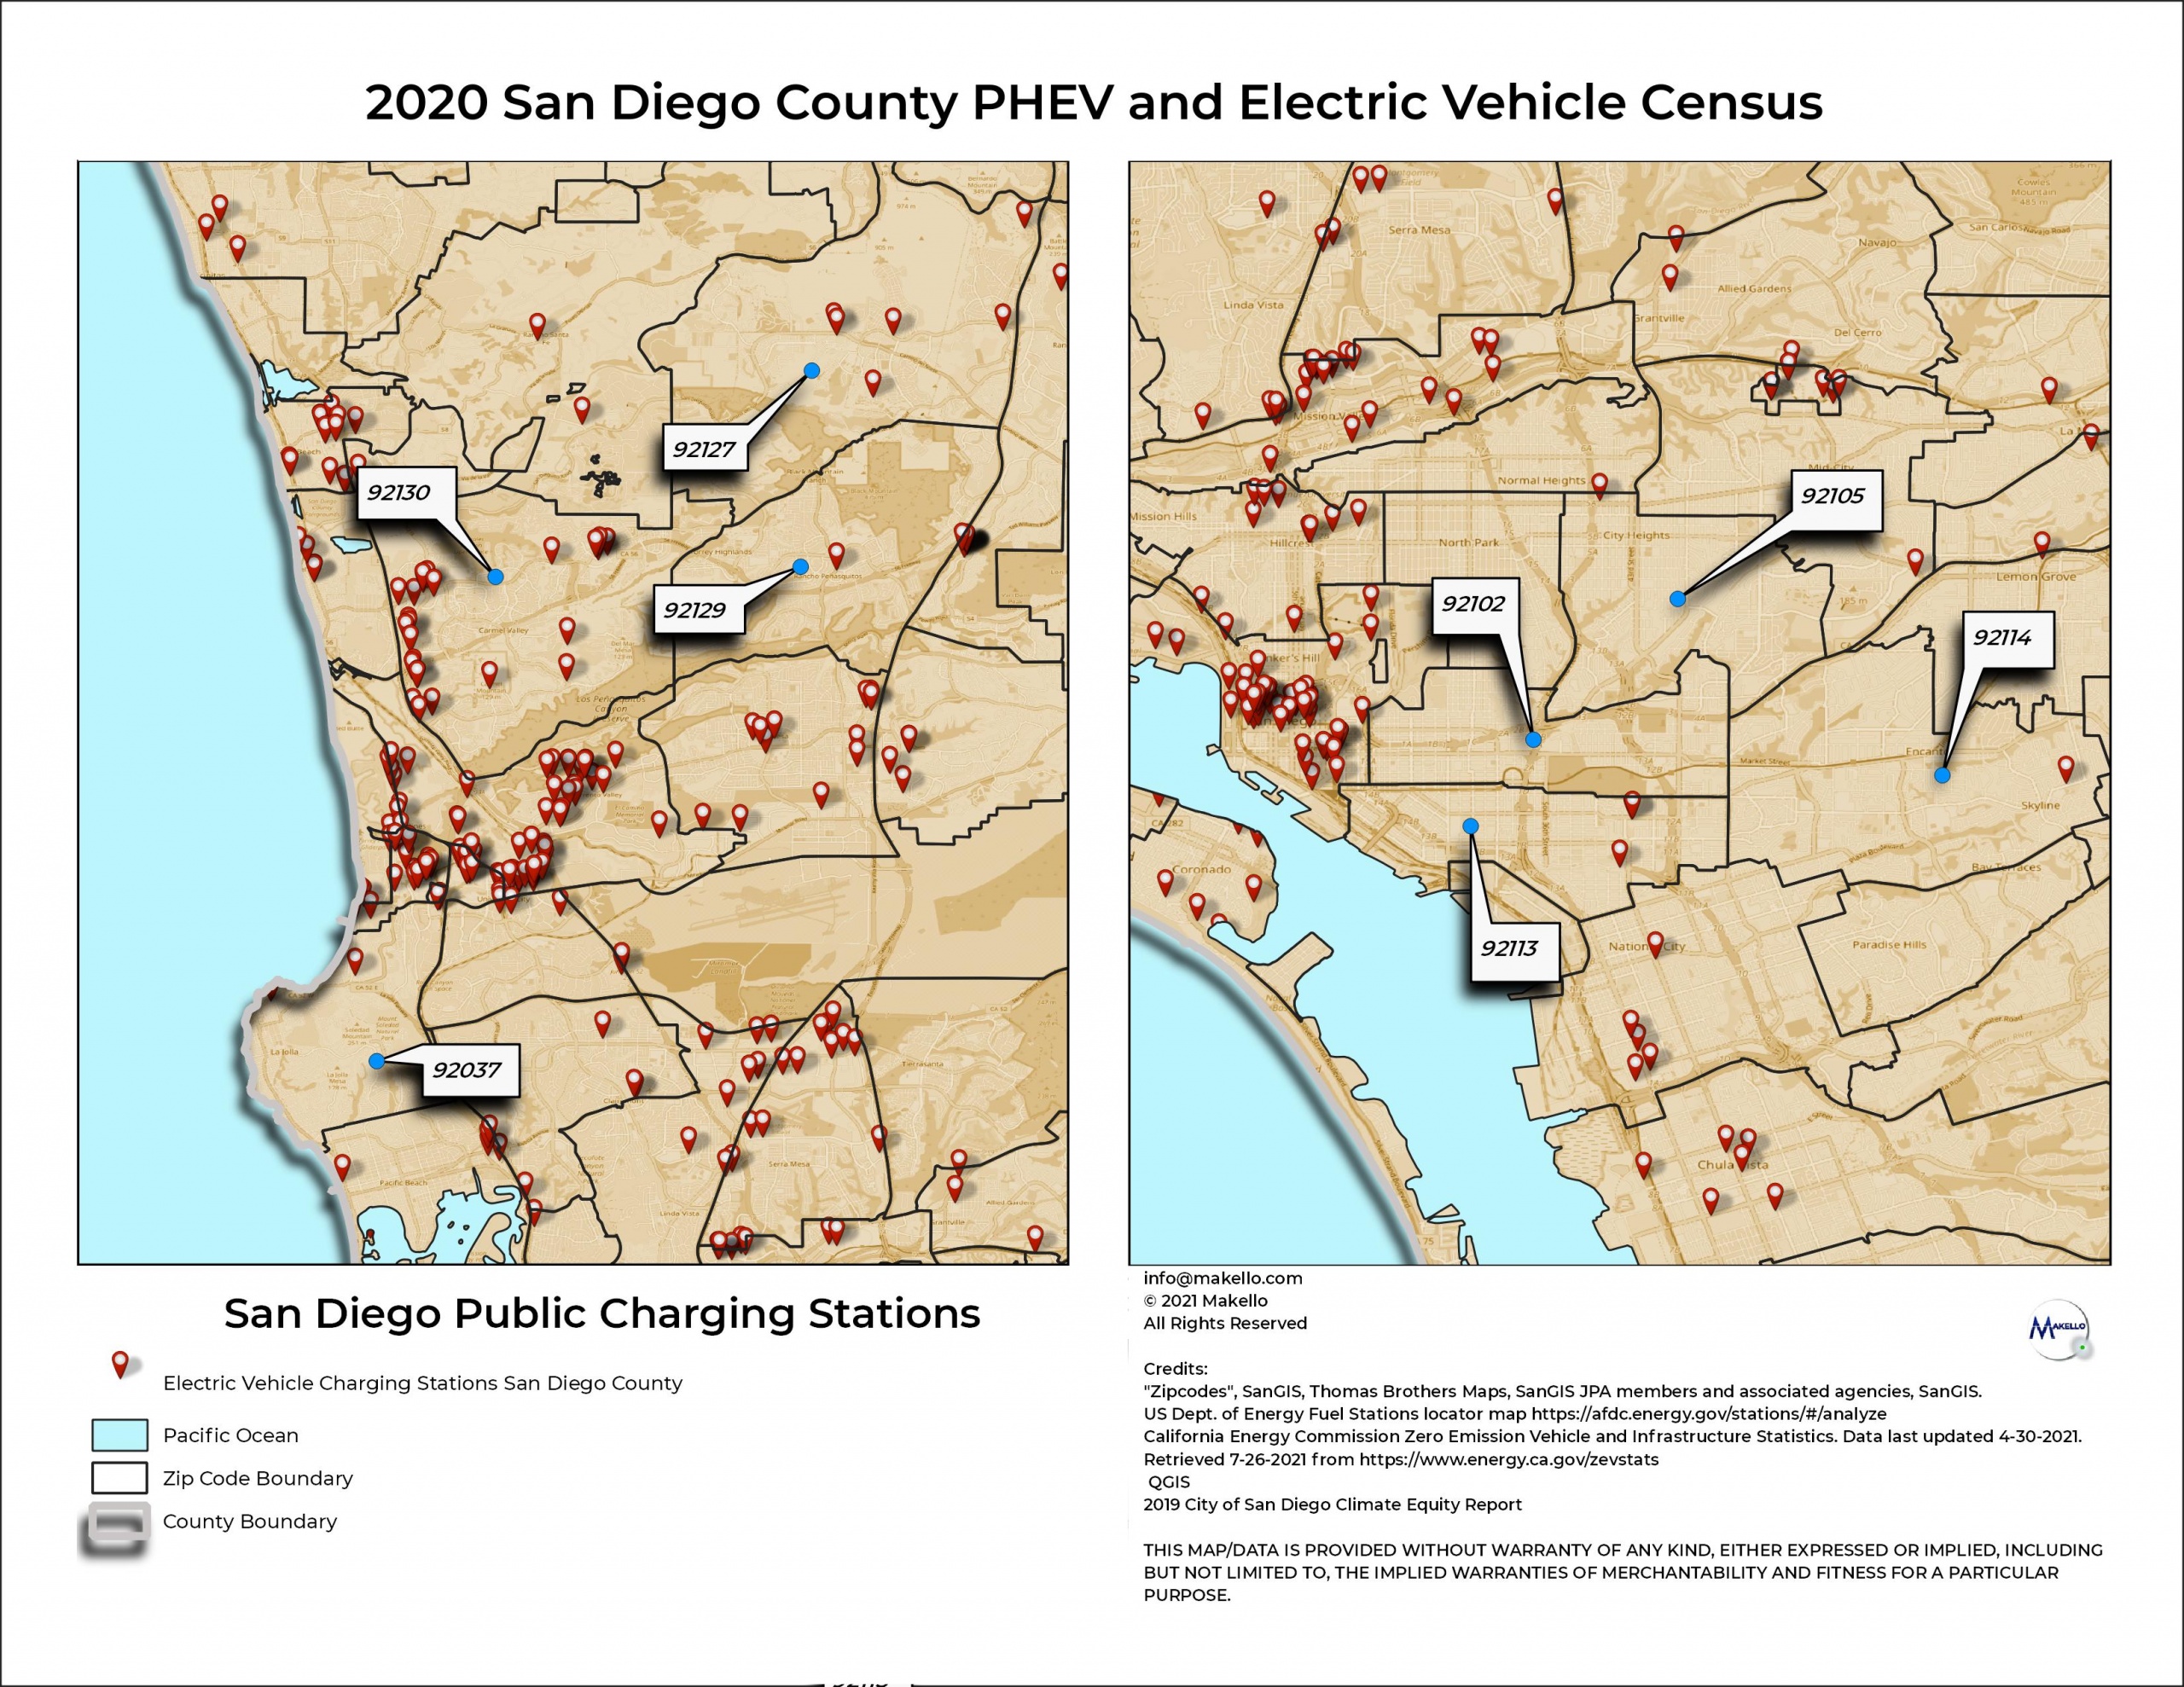
Generally, it is common for someone to think public charging stations are installed where people who purchase EV and PHEV vehicles live but this is not always the case. Types of housing such as single family housing or multi-family housing, housing density, commercial properties with retail and office space, and property owner interest are all additional factors that impact where public charging stations are installed. The Makello map shows there are several of the zip codes we chose to examine that do not have good access to public charging stations. It was surprising that there are gaps in access to public charging in the more affluent zip codes we examined. Below is a chart summarizing the statistics of the eight zip codes we examined.
| Zip Code | Median Income Range | EV- 2020 Sales | PHEV- 2020 Sales | Public Chargers |
| 92102 | $0- $114,985 | 149 | 112 | 0 |
| 92105 | $0- $76,657 | 172 | 212 | 1 |
| 92037 | $76,657- $191,642 | 1283 | 506 | 26 |
| 92113 | $0- $76,657 | 64 | 36 | 3 |
| 92114 | $38,328- $114,985 | 140 | 119 | 1 |
| 92127 | $76,657- $153,314 | 1694 | 578 | 6 |
| 92129 | $38,328- $191,642 | 979 | 533 | 1 |
| 92130 | $38,328- $191,642 | 2275 | 808 | 23 |
As you can see from the table, the residents in only one zip code we examined showed a preference for plug-in hybrid electric vehicle. Residents in all other zip codes preferred the battery electric vehicles. It is obvious from the chart that there are very few public chargers available compared to the number of vehicles in the zip codes. Presumably, the residents in these zip codes would like to be able to use a charger while they run errands around their neighborhood and have difficulty with the current number of available public charging stations.
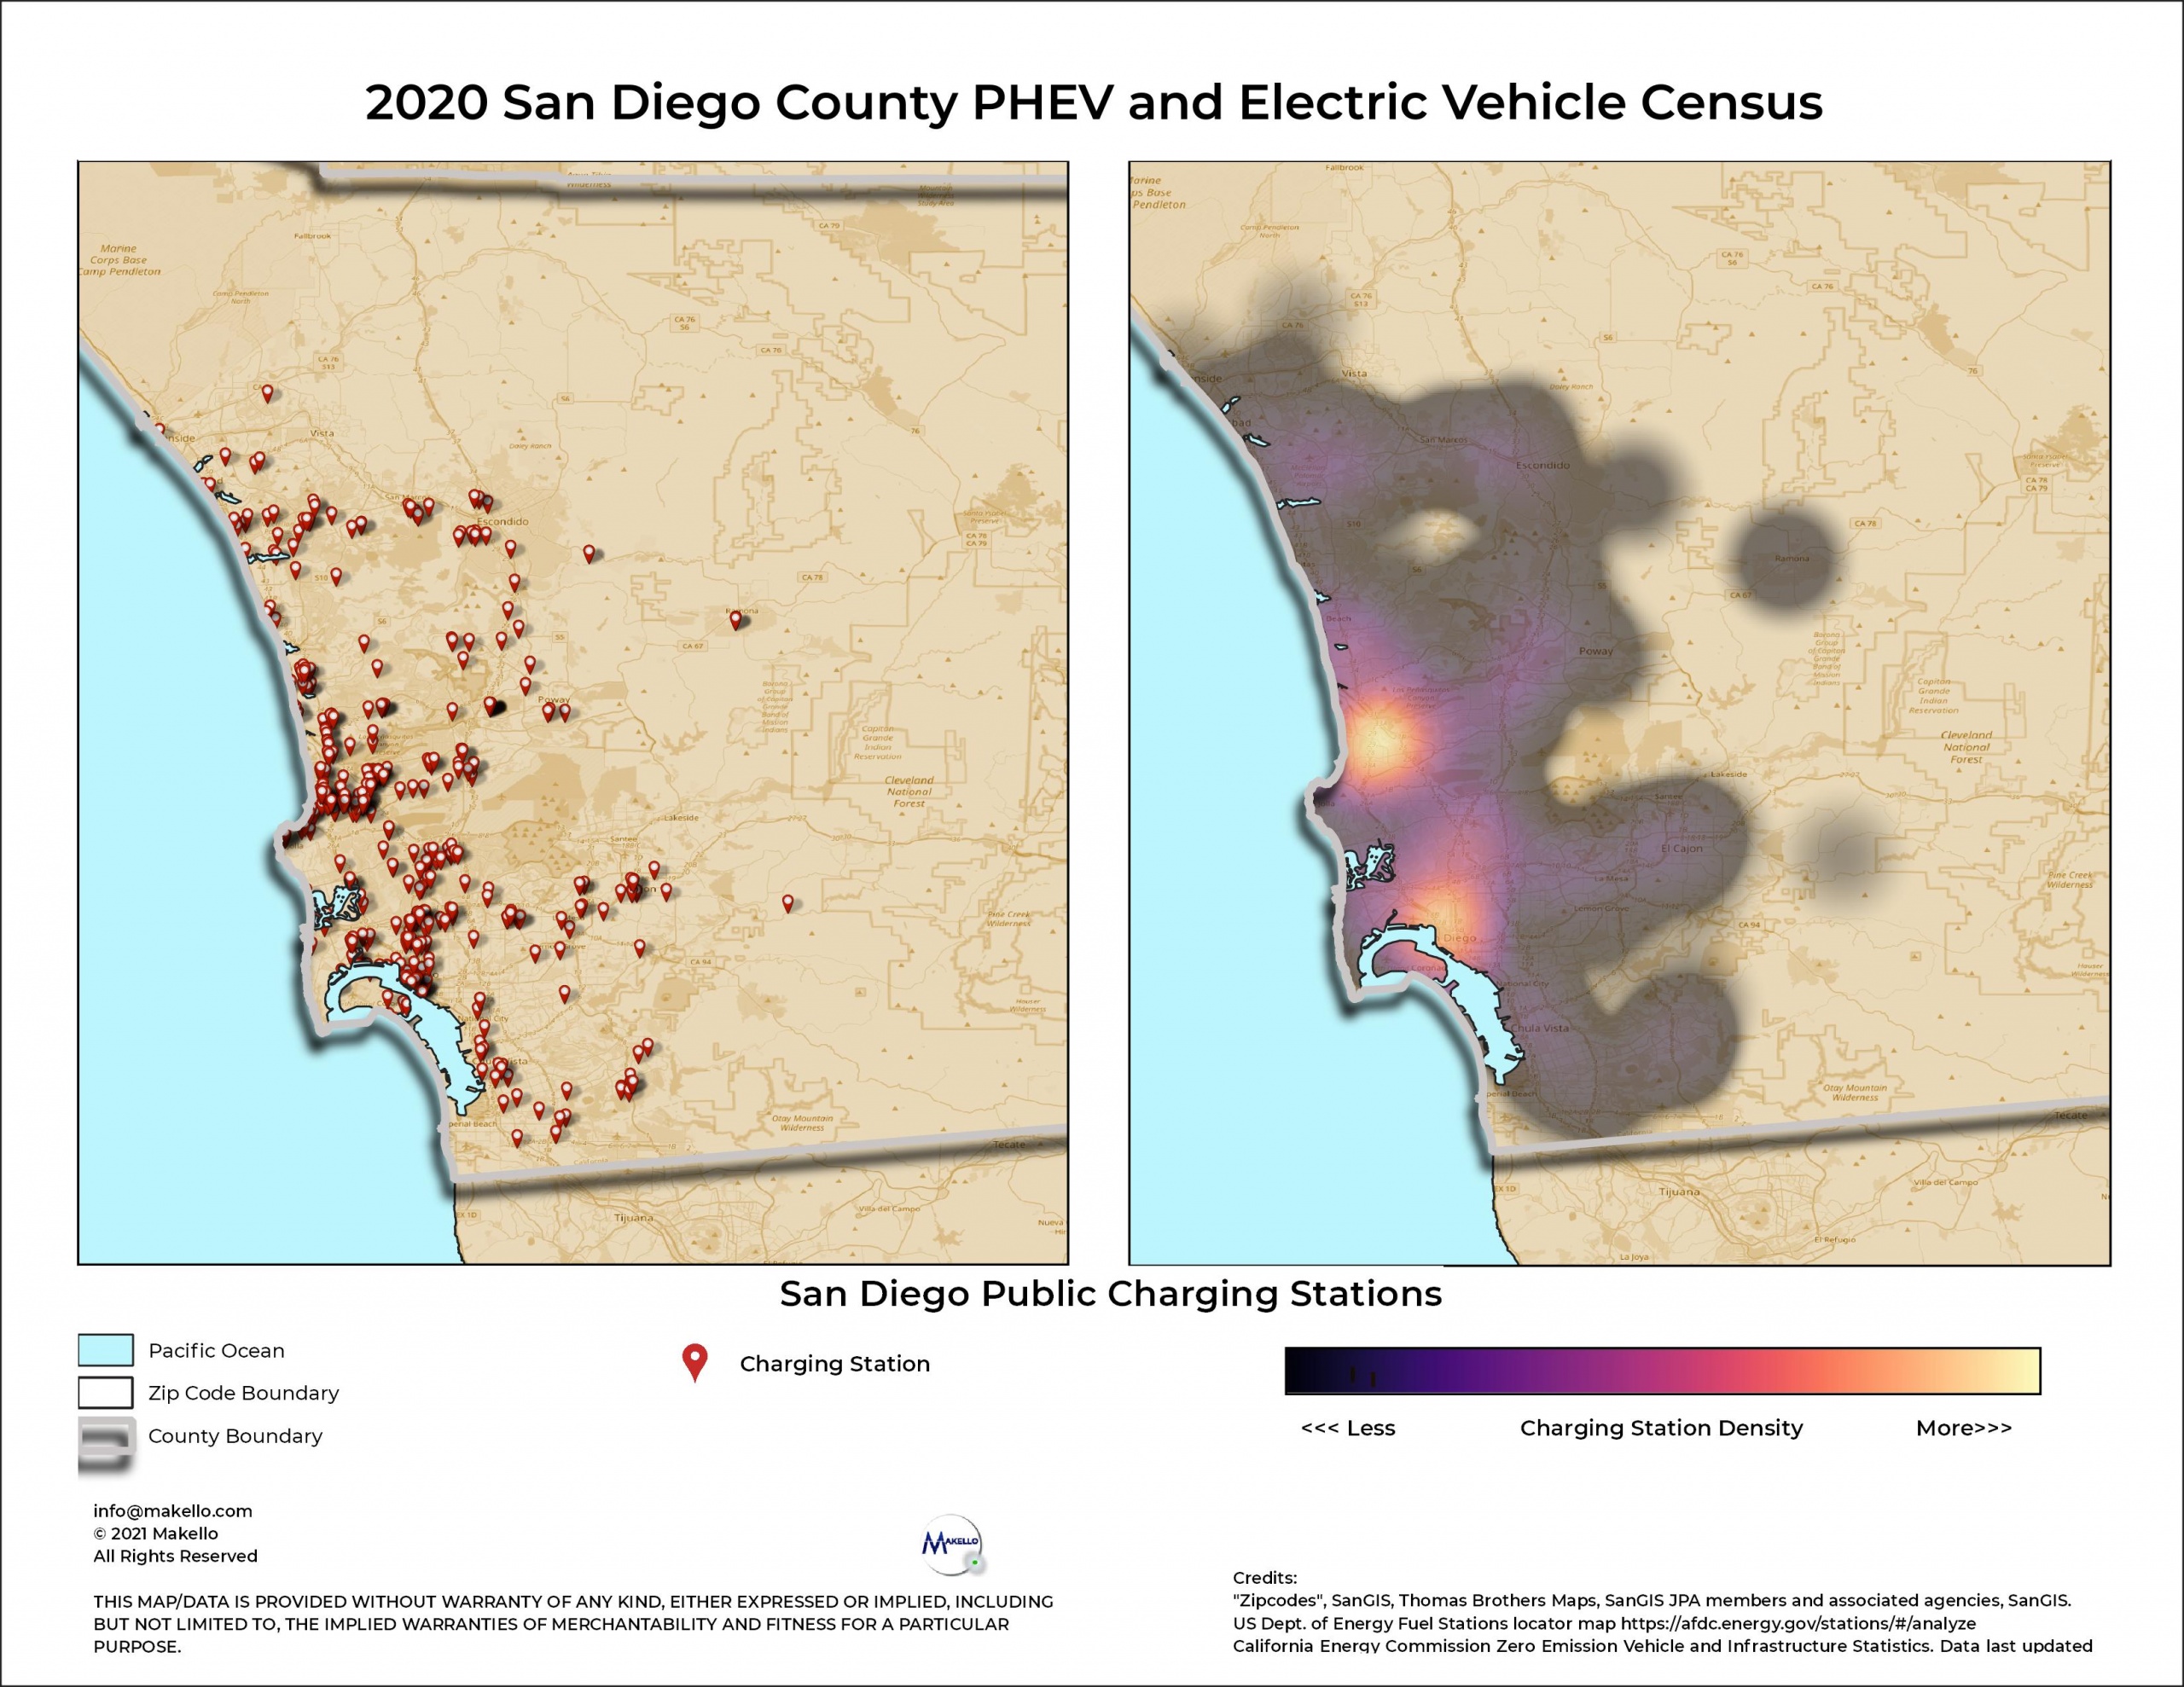
The final map above that Makello created is a heat map to highlight the distribution of public charging stations county wide. All of the charging stations are located in the western part of the county in the urban areas. There aren’t any charging stations listed in the data we downloaded in remote fueling stations or recreation areas.
The map of the charging station locations shows the stations tend to be clumped in proximity to other charging stations. This may be due to one commercial property owner sees neighbors installing charging stations then they decide to install. The most concentrated collection of public charging stations are located in downtown San Diego and around UC San Diego. Clearly, there are many areas of San Diego County that do not have access to public charging in their neighborhoods.
The maps Makello created show there are gaps in access to public vehicle charging stations. That lack of access may present many residents with obstacles to adoption of sustainable technology but the lack of access to public charging stations is not stopping all residents from purchasing battery electric and plug-in hybrid electric vehicles. This indicates an interest in the technology and when the opportunity presents itself to purchase EV or PHEV vheicles, many residents are making the decision to make that purchase.
Commercial property owners should use data when making the decision whether or not to install a charging station on their property rather than rely on perceptions because as we have shown, perceptions that residents in one area or another are not purchasing EV and PHEV may run counter to “common sense”.